I have written about this before but this time there is a video and some commentary on the possible outcomes and I give you some idea of how many trials you might need to carry out to get a full view of what your Monte Carlo Simulation is trying to do. My previous page is here: Dice and Coins
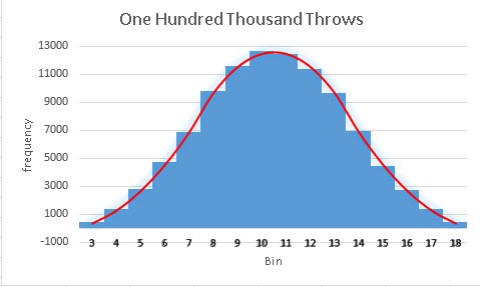
This page is self contained as you watch the video but in essence it shows what happens when you use =RANDBETWEEN(1,6) to simulate the rolling of three six sided fair dice when you simulate ten throws then 50 throws then … 100,000 throws. You will see these extreme outputs:
10 Throws including an overlay of the normal distribution curve for this simulation:
100,000 Throws including an overlay of the normal distribution curve for this simulation:
The normal distribution curve comes from here: this tables shows examples of all of the possible outcomes from throwing the three dice. For example, there is only one way of throwing a three which is 1 and and 1, there is only one way of throwing a total score of 18, that is 6 and 6 and 6. There are three ways of scoring a total of four:
1 and 1 and 2; 1 and 2 and 1; 2 and 1 and 1: whilst these contain the same three numbers each time, at any time you might throw 1 and 1 and 2 and at another time score four by throwing 1 and 2 and 1 … they are different for this purpose
In the video you will hear detailed explanations of what I did and what to look out for. Here is the video for you to watch, I put it on YouTube this time:
http://www.youtube.com/watch?v=26D95-i4FKs … please let me know of any problems with that link but I have tested it!
Here is my Excel file for you to play with: three_dice
Duncan Williamson


