The CAPM
The capital asset pricing model is well known in corporate finance and it includes the following expression
Re = Rf + β(Rm – Rf)
Which means, the required rate of return of a share is equal to the risk free rate of interest plus Beta times the difference between the risk free rate of interest and the return on the average share in the market. For example, if the risk free rate is 5%, the return on the average market share is, say, 8% and your organisation’s Beta is, say, 0.85 then your required rate of return is
= 5% + 0.85 * (8% – 5%)
= 5% + 0.85 * 3%
= 5% + 2.55%
= 7.55%
Finding Beta
It is relatively easy to find the value of Beta from many finance sites on the internet these days. For example, go to the Markets Data section of the Financial Times (www.ft.com) and you will find the Beta value for every share in its database of listed companies.
However, suppose you cannot find the beta for your organisation anywhere, what then? Well, that happened the other day when I was demonstrating some of the aspects of corporate finance, include Beta values, to a group and I wanted to illustrate the Beta value of an organisation for which one of my delegates worked. I couldn’t find the Beta value anywhere so I calculated it, as follows.
I found that www.bloomberg.com hosted the values of the stock market I was interested in as well as data on individual shares in that market. I was faced with the following chart but not the data that made up the chart:
Source: http://www.bloomberg.com/quote/SAVOLA:AB/chart
Fortunately, the chart included a slider: run the cursor over the chart and there is a mouseover that shows, date by date, the change in the stock market index from one day to the next. Similarly with the following chart of my target organisation, Savola, I was able to extract the change in share price from day to day by using the mouseover on there too:
Source: http://www.bloomberg.com/quote/SAVOLA:AB/chart
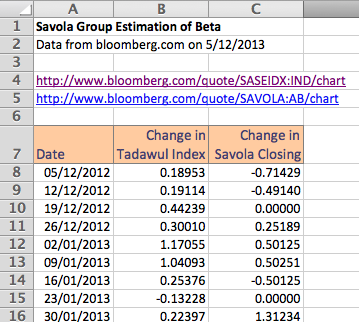
It took me some time but here is the beginning of the table of 53 data points I built up for the change in the stock market index and my target share price:
The beta value can be found in several ways, here are two of them:
=SLOPE(known_y’s,known_x’s)
=SLOPE(C8:C60,B8:B60)
= 1.6618
Enter the above function in any empty cell and the result is an estimate of the Beta value for this share based on the data points used.
Draw the graph of the changes in the market index (X) and the changes in the share price (Y) and by adding the Trendline and the regression equation we can see the Beta value … Y = 1.6618X + 0.1138 … Beta = 1.6618
The Meaning of Beta
What the value of Beta tells us, to some extent, is the risk or variability of a share. The market average Beta value is 1. That is, a share that changes precisely in tune with the market will have a Beta of 1: for every 1% change in the market, there will be a 1% change in the share price, for example.
Savola has a Beta of 1.6618 which means it is a riskier investment than the average share: the rule is, the higher the Beta value, the greater the risk. A result of 1.6618 says that for a 1% change (up or down) in the market index, Savola’s share price will change (up or down) by 1.6618% … on average, based on our sample of 53 days’ data from the last year of trading on the Saudi Arabian stock market, Tadawul.
Quality of Estimate of the Beta Value
I have to point out that the data we have used here might need to be refined or watched carefully as the estimate of Beta is based on linear estimation and yet just by looking at the graph, we can see that the relationship between the changes in the market and the changes in the share price might not be linear. Further work needed here! In addition, notice that the value of r2 on the graph is only 0.32675, which is very low.
I can also point out that if you download the Excel file I have developed for this (see link below), you will see that when I used just 8 observations of index and price change data, I estimated the Beta for Savola to be just 0.8314.
Conclusion
That’s it! It took me a lot longer to extract the data for this example than it did to find the Beta value which, using the SLOPE function, took just seconds. Drawing the graph took a little longer but not much.
Finally, a sample size of 53 data points might not be sufficient to give the exact value of Beta but that’s not the point here. What I wanted to do was to demonstrate data collection and Beta estimation. Any further discussion is outside the scope of this article! I am sure that you will have found this article useful if you have got this far anyway!
Duncan Williamson
5th December 2013 … it is the King of Thailand’s 86th birthday today: long live the King!
Download the file here: savola_beta


