I talk about INDEX more than I use it. Well, that was true until the other week when I learned what you are about to see. You can create and use a LINEST function that is built inside the INDEX function and that just calls or outputs the LINEST answers you need. That is, you don’t need to generate an entire LINEST table.
That’s a bit wordy but this is what it means: let’s review the LINEST function then let’s look at how to use LINEST within INDEX.
LINEST is an array entered function that can give us four sets of output
- Without statistics and with a constant (intercept)
- Without statistics and without a constant
- With statistics and with a constant (intercept)
- With statistics and without a constant
My example shows example three only in which the LINEST function is set up in the range K13:L17. See the downloadable Excel file to see that raw data for Revenue and Net Income on which this example is based, link at the end.
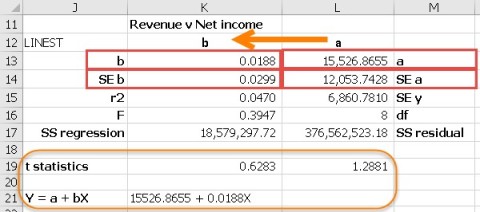
Please note that Excel builds this table from right to left: that is, you find the intercept, a, in column L and the coefficient of X, b, in column K … and so on. The boxes joining J and K 13 show that 0.0188 is the value of b …
The t statistics are derived from the table and the formula is derived from the table too: that’s why I have highlighted them with their own box!
LINEST with INDEX
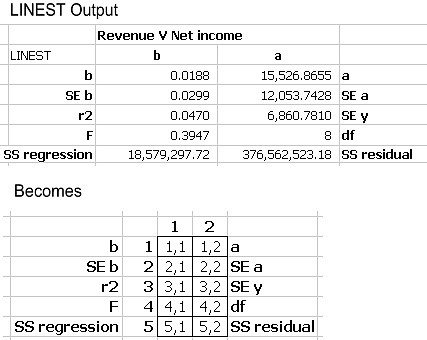
In reality we can combine the LINEST and INDEX functions so that we don’t need to construct all of the LINEST table. For this combination, the LINEST output table, repeated again below, becomes the matrix below that.
For example, the b cell becomes 1,1, the a cell becomes 2,1 … as you can see:
So, to make these combinations work, we do this
=INDEX(LINEST(ni,rev,1,1),1,1) will find the Slope of the b variable
=INDEX(LINEST(ni,rev,1,1),2,1) will find the standard error of the b variable
=INDEX(LINEST(ni,rev,1,1),4,2) will find the degrees of freedom
This means we can take one value at a time and enter it as and where we like and we don’t have to stick rigidly to the tabular format that Excel uses with the full LINEST output table.
You can repeat all of the above for the Total Costs and Expenses v Net Income example.
File link, download from here index_linest_regression
Duncan Williamson
