There are articles here that discuss regression analysis and linear regression and how to find regression equations. Did you know that you can program Excel to tell you the detail of the results from the Trendline utility? I mean not only linear but exponential, logarithmic, power and even polynomial orders 2, 3, 4 ,5 and 6.
Here are some screenshots for you: I cannot give you the full spreadsheet but if you need assistance with these formulas just let me know and I will help.
The data are called by means of the combo box that I have placed on cell A4 and the data are in the range B6:K6: click on the graphic to enlarge it.
The rows 7 and down comprise the predictions and residuals … one range per prediction and residual.
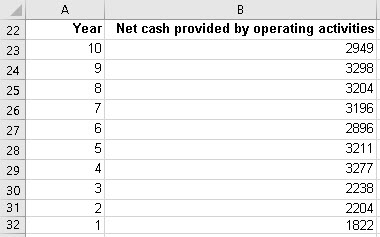
I have summarised the data that are called by the combo box in the range A22:B32 … you could do the same when you program these formulas.
To help with verifying your results, I recommend creating a graph for each of the formulas you will prepare and add a trendline with equation to help with that: click on the graphic to enlarge it.
I have also prepared the residuals plots for your information.
Now the results of all of my efforts … ready for entering into the range in screenshot 1 above. I have also included at the bottom of each section in this screenshot the formula I used in the area in screenshot 1
Now, the formulas and labels you will need to complete this exercise: as before, click to enlarge!
The formulas are all entered as ARRAY formulas EXCLUDING the t statistics results and the usage and Alternatives … they are not part of the array formulas.
These are not difficult but they do take concentration and I do apologise for not being able to give you the spreadsheet itself.
Best wishes
Duncan Williamson
17th February 2017


