Introduction
That’s what you call a cheesy headline but it keeps me happy!
The subject of this page is something that might have worried you in the past as it has worried me. What I am talking about is the problems we face when we include dates or years in time series analysis. More especially when we want to, for example, carry out some form of regression analysis on time series data and then use the regression equation in a forecast or a budget or something like that. That can be a problem!
Development
I first came across this problem three or four years ago when I was analysing Toyota’s motor vehicle output and although the scattergraph and linear trendline equation showed nothing wrong, when I applied the formula, nothing made sense. Take a look:
Here is the graph together with the trendline I drew:
I haven’t labelled anything but years are the independent variable and Sales in $ million are the dependent variable. I used order 3 polynomial trendline analysis to provide me with the regression equation and R2 value. It looks OK doesn’t it!
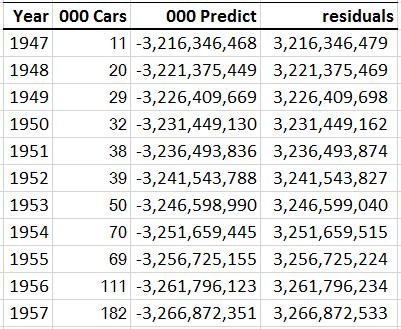
When I use that regression equation, however, this happened:
Look at the prediction for 1947! When they actually only produced 11,000 cars, Excel is predicting minus 3.2 billion cars … and essentially the same prediction each year. Clearly something is wrong.
When this happened I checked and checked everything many times. In the end, I asked around the Excel community and whilst I didn’t get an answer, I was recommended to use year numbers rather than year dates. For example, make 1947 = 0, 1948 = 1 and so on. Recently, I have come across the suggestion to make 1947 = -67 … 67 years ago …
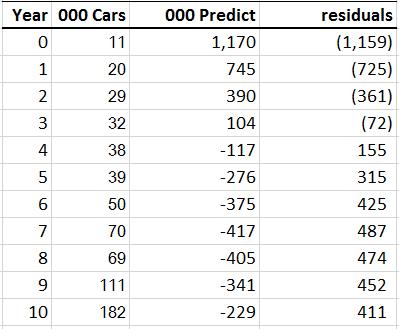
Let’s cut a long story short now and show you what happens when we change 1947 to 0, 1948 to 1 etc:
Look at this, too:
y = -0.4545x3 + 35.325x2 – 389.29x + 744.78
R² = 0.9931
The regression equation has changed although the R2 value hasn’t.
What you can see clearly is that the -3.2 billion sales prediction has changed to something much more reasonable. In the early stages of this analysis, which we see in the table above, the predictions are not necessarily that good: the residuals are high. Later on, the prediction improves, more in line with what we can see on the graph!
What Went Wrong?
First of all, anyone who did what I did is innocent of any wrongdoing! I understand that the problem rests in the size of Excel’s powerbanks (I made that word up!). In other words, the combinations of years as dates means that the numbers Excel ends up calculating are just too large for it. So, scaling them back by the best part of 2,000 years is a smart thing to do.
Years as Numbers are Better Anyway
In any case, the results of regression analysis when using years as numbers rather than years as dates provides us with much more meaningful results. For example, imagine that our Japanese car manufacturing results had given us reasonable values, how would you have interpreted a year value of zero: that is year 0? It would almost certainly have been a negative number and would have suggested something, negative or positive, that was inappropriate 1,900 years ago anyway!
By resetting things relative to today and working backwards, the year number of 0 in the Japanese car example tells us directly that, starting in 1947 … when we estimate that car output was xxx,xxx … we can actually understand and appreciate that!
Summary
In summary, this happened to me a few years ago and initially I had no idea what it meant or what to do about it. Still, I used to present it at my training sessions and leave it hanging in the air. Then I asked around the Excel community and someone said he didn’t know why it happened but he was the first to tell me to use years as numbers rather than years as dates.
Since then, this has happened to me again several times over the last few months and now I am able to explain it, following a hint from Prof Wayne Winston in one of his online videos.
Now you know, too. You also know that using years as numbers essentially rebases your dates and it makes your intercept values much more realistic and meaningful.
Downloads:
years_as_numbers in which you can try out what I have been talking about here; and
dates_numbers … a 16.2 Mb PowerPoint file that contains a video showing you how to do what I did!
Duncan Williamson


18 12 2014 at 9:26 am
[…] 16th December 2014: my new page Going on a Date? Ask for the Number! is for anyone who uses regression analysis on time series data. It relates to the use and understanding of years as dates … read on: tips … other Menu. There is something wrong with the menus at the moment so the URL for this page is … here … […]